> ## Documentation Index
> Fetch the complete documentation index at: https://ade-ac1c6011-dependabot-github-actions-actions-cache-6.mintlify.site/llms.txt
> Use this file to discover all available pages before exploring further.
# Browser
> ADE's built-in browser pane in Work — open pages beside your code, inspect elements, and hand exactly what you see to an agent.
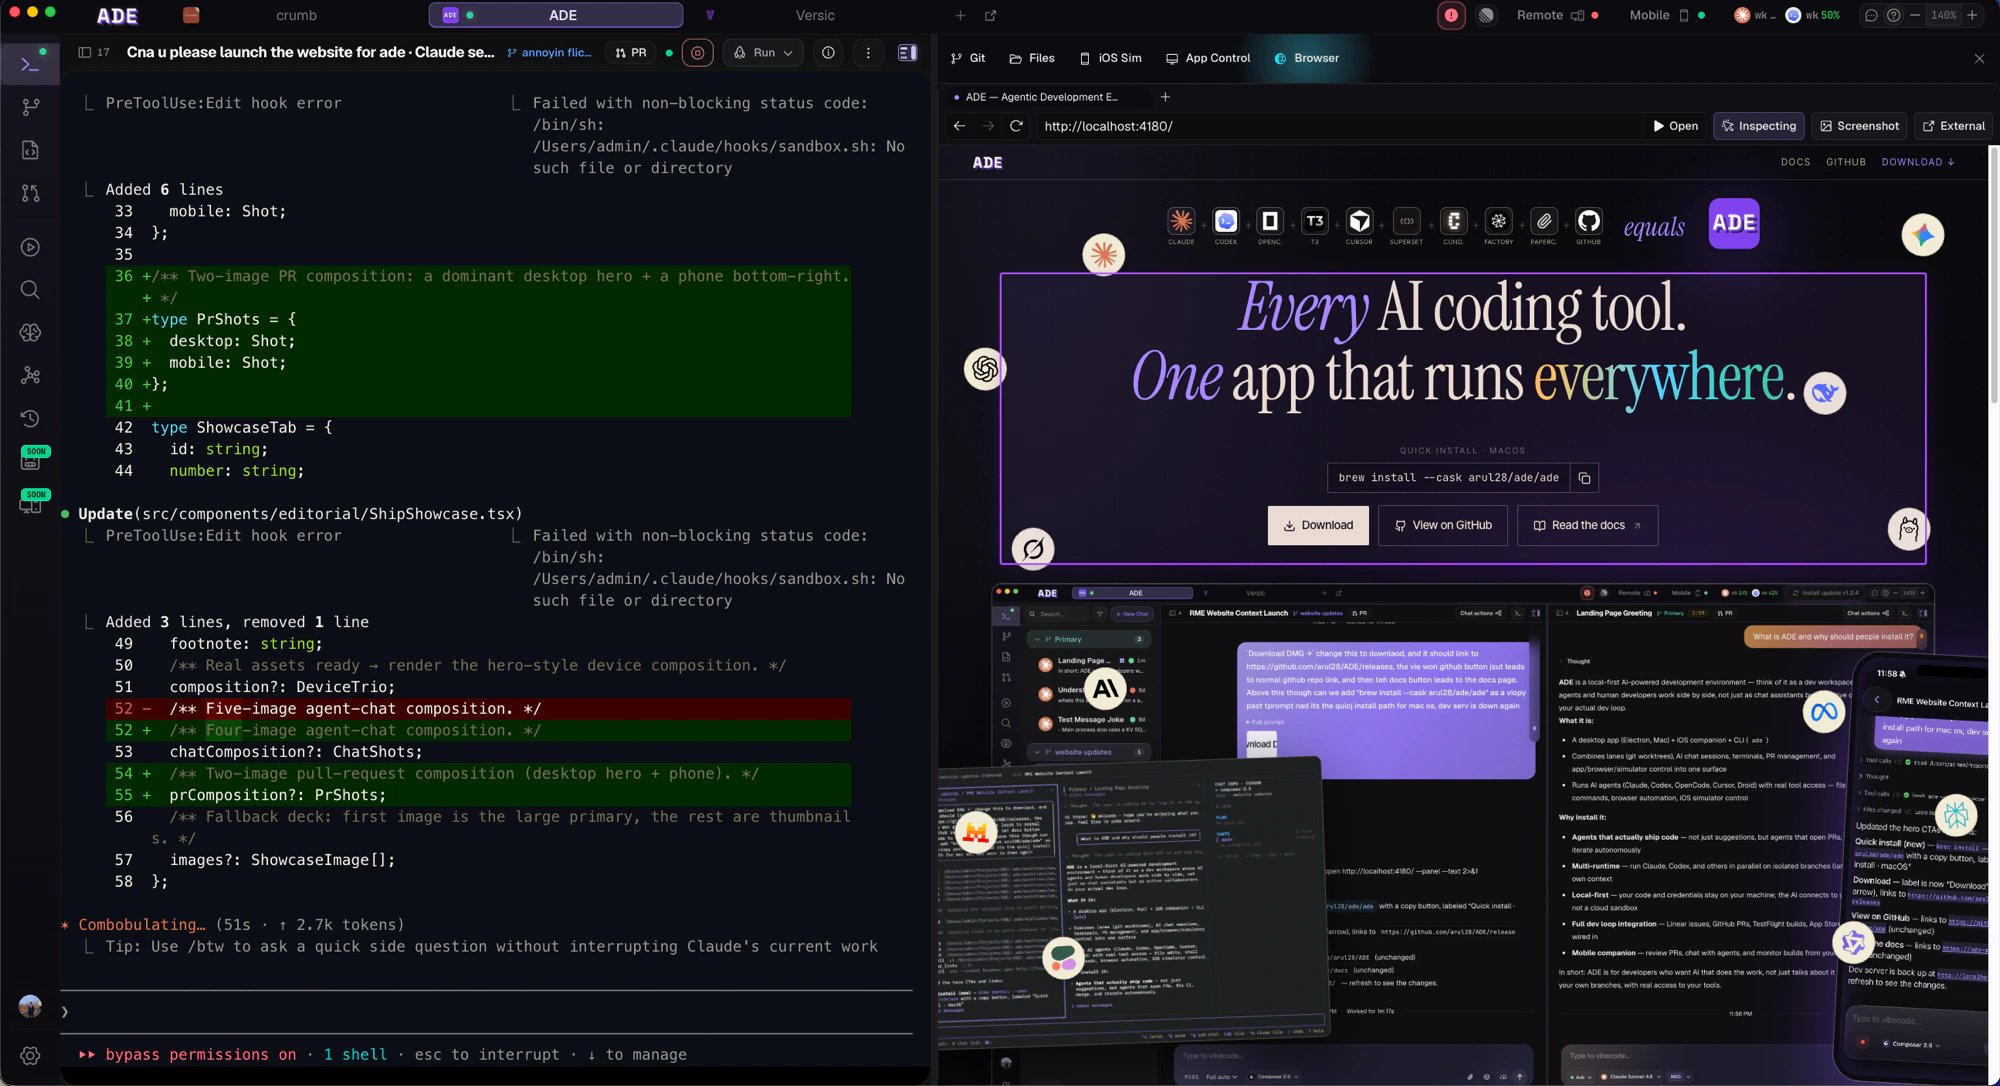
The **Browser** lives in the Work tab, right next to your chat. Open a web page beside the code that drives it, inspect an element, and hand exactly what you're looking at to an agent — no copy-pasting URLs or describing the bug in prose.
## Code and page, side by side
The browser opens on the Work right-edge sidebar, in the same surface as your agent chat — so the page you're testing and the agent fixing it share one screen. Change code in a lane, reload the page, and see the result without leaving ADE.
Unlike the lane-scoped tools, the browser belongs to the **ADE window**: each window owns its own tabs and active page, while all windows share one signed-in session, so a site you log into once stays logged in across them.
 ## Inspect and hand off
Switch the pane into inspect mode and a DevTools-style outline tracks the element under your pointer. Click to commit it, and ADE captures the element — its markup, a stable selector, what's rendered, and a screenshot — then attaches it to the active chat as a context chip. Instead of "the button looks wrong," the agent gets the actual element it needs to fix.
## Inspect and hand off
Switch the pane into inspect mode and a DevTools-style outline tracks the element under your pointer. Click to commit it, and ADE captures the element — its markup, a stable selector, what's rendered, and a screenshot — then attaches it to the active chat as a context chip. Instead of "the button looks wrong," the agent gets the actual element it needs to fix.
 ## What it's for
Reload the running app and confirm an agent's fix actually landed.
Select an element or page state and pass it straight into a chat.
Grab what you see as an artifact attached to the work.
Point the browser at the dev server you started in [Run](/tools/project-home) — the page and the process that serves it stay in the same lane, so a reload reflects the lane's latest code.
## Drive it from anywhere
The same browser is scriptable. The `ade browser` CLI surface lets an agent — or you — navigate, screenshot, inspect, and pick context from the shared tabs, so a chat agent can drive the page it's reasoning about.
Hand browser context to an agent and let it work.
Drive apps and capture evidence of what happened.
## What it's for
Reload the running app and confirm an agent's fix actually landed.
Select an element or page state and pass it straight into a chat.
Grab what you see as an artifact attached to the work.
Point the browser at the dev server you started in [Run](/tools/project-home) — the page and the process that serves it stay in the same lane, so a reload reflects the lane's latest code.
## Drive it from anywhere
The same browser is scriptable. The `ade browser` CLI surface lets an agent — or you — navigate, screenshot, inspect, and pick context from the shared tabs, so a chat agent can drive the page it's reasoning about.
Hand browser context to an agent and let it work.
Drive apps and capture evidence of what happened.