> ## Documentation Index
> Fetch the complete documentation index at: https://ade-ac1c6011-dependabot-github-actions-actions-cache-6.mintlify.site/llms.txt
> Use this file to discover all available pages before exploring further.
# Workspace graph
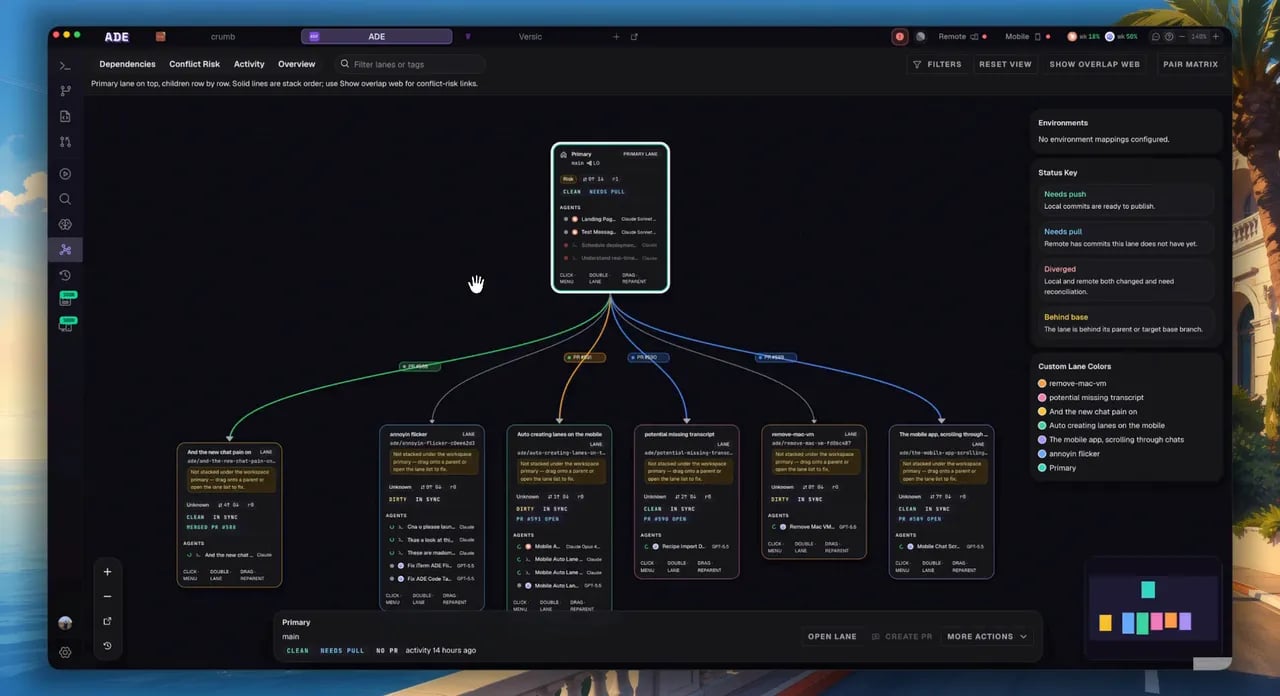
> A visual map of your lanes, stacks, PRs, and merge risk — rendered on a live canvas.
The **Graph** tab turns your repository state into a spatial map. It projects the same lanes, conflicts, PRs, and git state the rest of the app uses onto a React Flow canvas — topology, stack structure, PR overlays, and pairwise merge risk — so you can see how work relates when the lane list isn't enough.
Lanes laid out from the primary down, each child under its parent, with stack edges drawn between them.
Risk-colored edges and a pairwise matrix show which branches are likely to collide before merge time.
Click into a lane, open an agent, or jump straight into a conflict's resolution panel.
## What the graph shows
The canvas builds up in layers so it's usable before every overlay finishes loading: topology first, then risk, PR, and sync overlays stage in after the first paint.
 Every lane is a node carrying its own state — role (primary, attached, worktree, or integration), conflict status, sync state, PR badge, and a live count of the agents running in it. Edges encode the relationships:
* **Stack edges** — parent-to-child links that read top to bottom.
* **Risk edges** — colored by pairwise conflict risk between overlapping lanes.
* **PR overlays** — per-lane badges and edge coloring derived from PR state.
* **Integration proposal nodes** — merge-plan proposals with their source lanes chipped in.
## View modes
All four modes share the same primary-centric layout, so switching between them never rearranges the canvas.
| Mode | What it emphasizes |
| ----------------- | ----------------------------------------------------------------------------------------- |
| **Overview** | The stack tree. The risk "overlap web" is hidden by default — one click away. |
| **Dependencies** | Parent-child stack edges; drag a node to reparent it. |
| **Conflict Risk** | Risk edges always drawn between overlapping lanes, with the matrix for file-level detail. |
| **Activity** | The same layout, with busy lanes sorted and sized up by recent activity. |
## Interact with it
Open the conflict panel: merge simulation outcome, the overlapping file list, and the AI proposal apply flow.
Reparent, archive, delete, create a child, view the diff, or open a terminal — straight from the node.
Hide a lane's descendants; the parent shows how many are tucked away.
Narrow by status, lane type, tags, or text; pan, zoom, and use the minimap to navigate large graphs.
## Merge simulation
Clicking an edge runs a real merge simulation and surfaces likely conflicts inline, alongside the overlapping files and an AI resolution flow. Treat the result as a warning system, not a substitute for final CI and review — re-run it after major commits.
Graph is most useful late in a work session, when you're deciding merge order and cleanup across several lanes at once.
Predict, simulate, and resolve overlapping changes before they reach a PR.
Build branch chains and reviewable stacks.
Every lane is a node carrying its own state — role (primary, attached, worktree, or integration), conflict status, sync state, PR badge, and a live count of the agents running in it. Edges encode the relationships:
* **Stack edges** — parent-to-child links that read top to bottom.
* **Risk edges** — colored by pairwise conflict risk between overlapping lanes.
* **PR overlays** — per-lane badges and edge coloring derived from PR state.
* **Integration proposal nodes** — merge-plan proposals with their source lanes chipped in.
## View modes
All four modes share the same primary-centric layout, so switching between them never rearranges the canvas.
| Mode | What it emphasizes |
| ----------------- | ----------------------------------------------------------------------------------------- |
| **Overview** | The stack tree. The risk "overlap web" is hidden by default — one click away. |
| **Dependencies** | Parent-child stack edges; drag a node to reparent it. |
| **Conflict Risk** | Risk edges always drawn between overlapping lanes, with the matrix for file-level detail. |
| **Activity** | The same layout, with busy lanes sorted and sized up by recent activity. |
## Interact with it
Open the conflict panel: merge simulation outcome, the overlapping file list, and the AI proposal apply flow.
Reparent, archive, delete, create a child, view the diff, or open a terminal — straight from the node.
Hide a lane's descendants; the parent shows how many are tucked away.
Narrow by status, lane type, tags, or text; pan, zoom, and use the minimap to navigate large graphs.
## Merge simulation
Clicking an edge runs a real merge simulation and surfaces likely conflicts inline, alongside the overlapping files and an AI resolution flow. Treat the result as a warning system, not a substitute for final CI and review — re-run it after major commits.
Graph is most useful late in a work session, when you're deciding merge order and cleanup across several lanes at once.
Predict, simulate, and resolve overlapping changes before they reach a PR.
Build branch chains and reviewable stacks.